The problem
While converting the old-style functional tests in the MongoDB project from WebTestBase to BrowserTestBase, I stumbled upon a problem: after following the drupal.org instructions to run PHPunit tests from PhpStorm, doing step-by-step debugging in the IDE worked nicely, but then stopped at the first $this->drupalLogin(); call, returning a 404 after a very long delay, although the same call running without debugging worked normally. What could be going on ?
The diagnostic
Stepping into UiHelperTrait::drupalLogin(), I noticed the delay occurent during the drupalGet('user/login') call early in the method, before submitting the account identification. Could it be the issue ?
Indeed, evaluating the result of the call via $this->getSession()->getStatusCode(); after that call returned show a 504 Timeout HTTP status code. And indeed, dumping the page with $this->getSession()->getPage()->getContent() show it to contain a typically timeout page.
Examining the logs showed the timeout happened at the PHP level, during the opposite direction call performed by Xdebug towards the debugging client, although such calls obviously worked since I'd been stepping through code for hours before that.
The solution
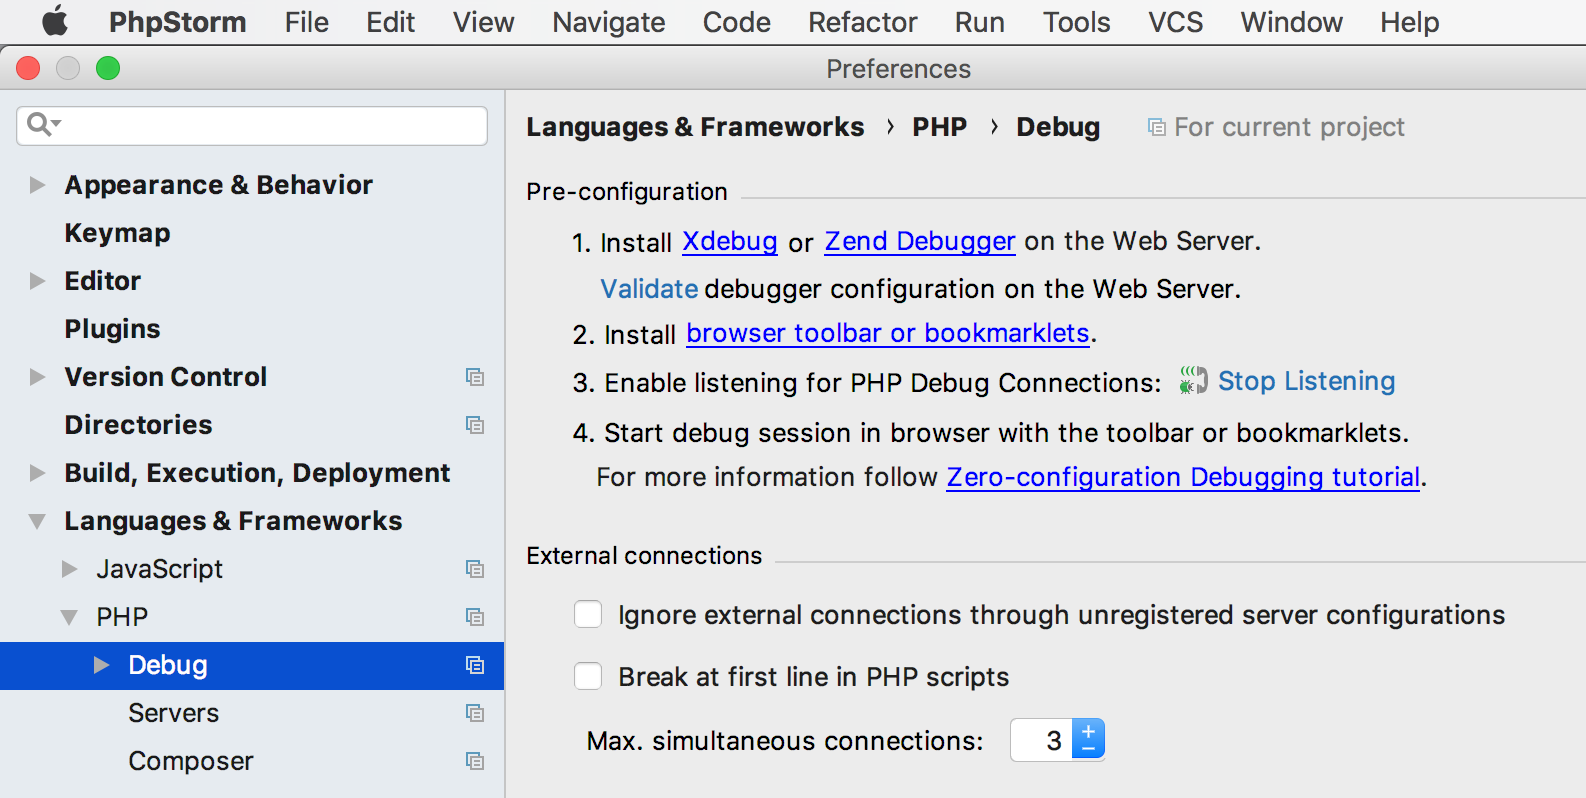
The solution was suggested by the always helpful and knowledgeable @berdir : PhpStorm happens to set a limit to the number of simultaneous connections it will accept for debugging, and that limit is 1 by default.
All of a sudden, it made sense: during classical debugging, the PHP interpreter from the host site establishes one connection to the client (the PhpStorm IDE), but when invoking the child site during such a call, a second instance of the interpreter is started and tries to connect too... but is blocked by the single connection limit of the default configuration.
 So all it takes is increase the number of connections!
In PhpStorm 2018.1.2 for macOS, the settings can be found at PhpStorm / Preferences / Languages & Frameworks / PHP / Debug in the External connections part of the right pane, as shown below.
No need to restart the IDE or PHP, just restart the debugging run configuration, and it works beautifully.
thanks
Just had to use XDebug and this came in handy. Thanks!