How to add a server load graph to a Graylog dashboard

Submitted by Frederic Marand on

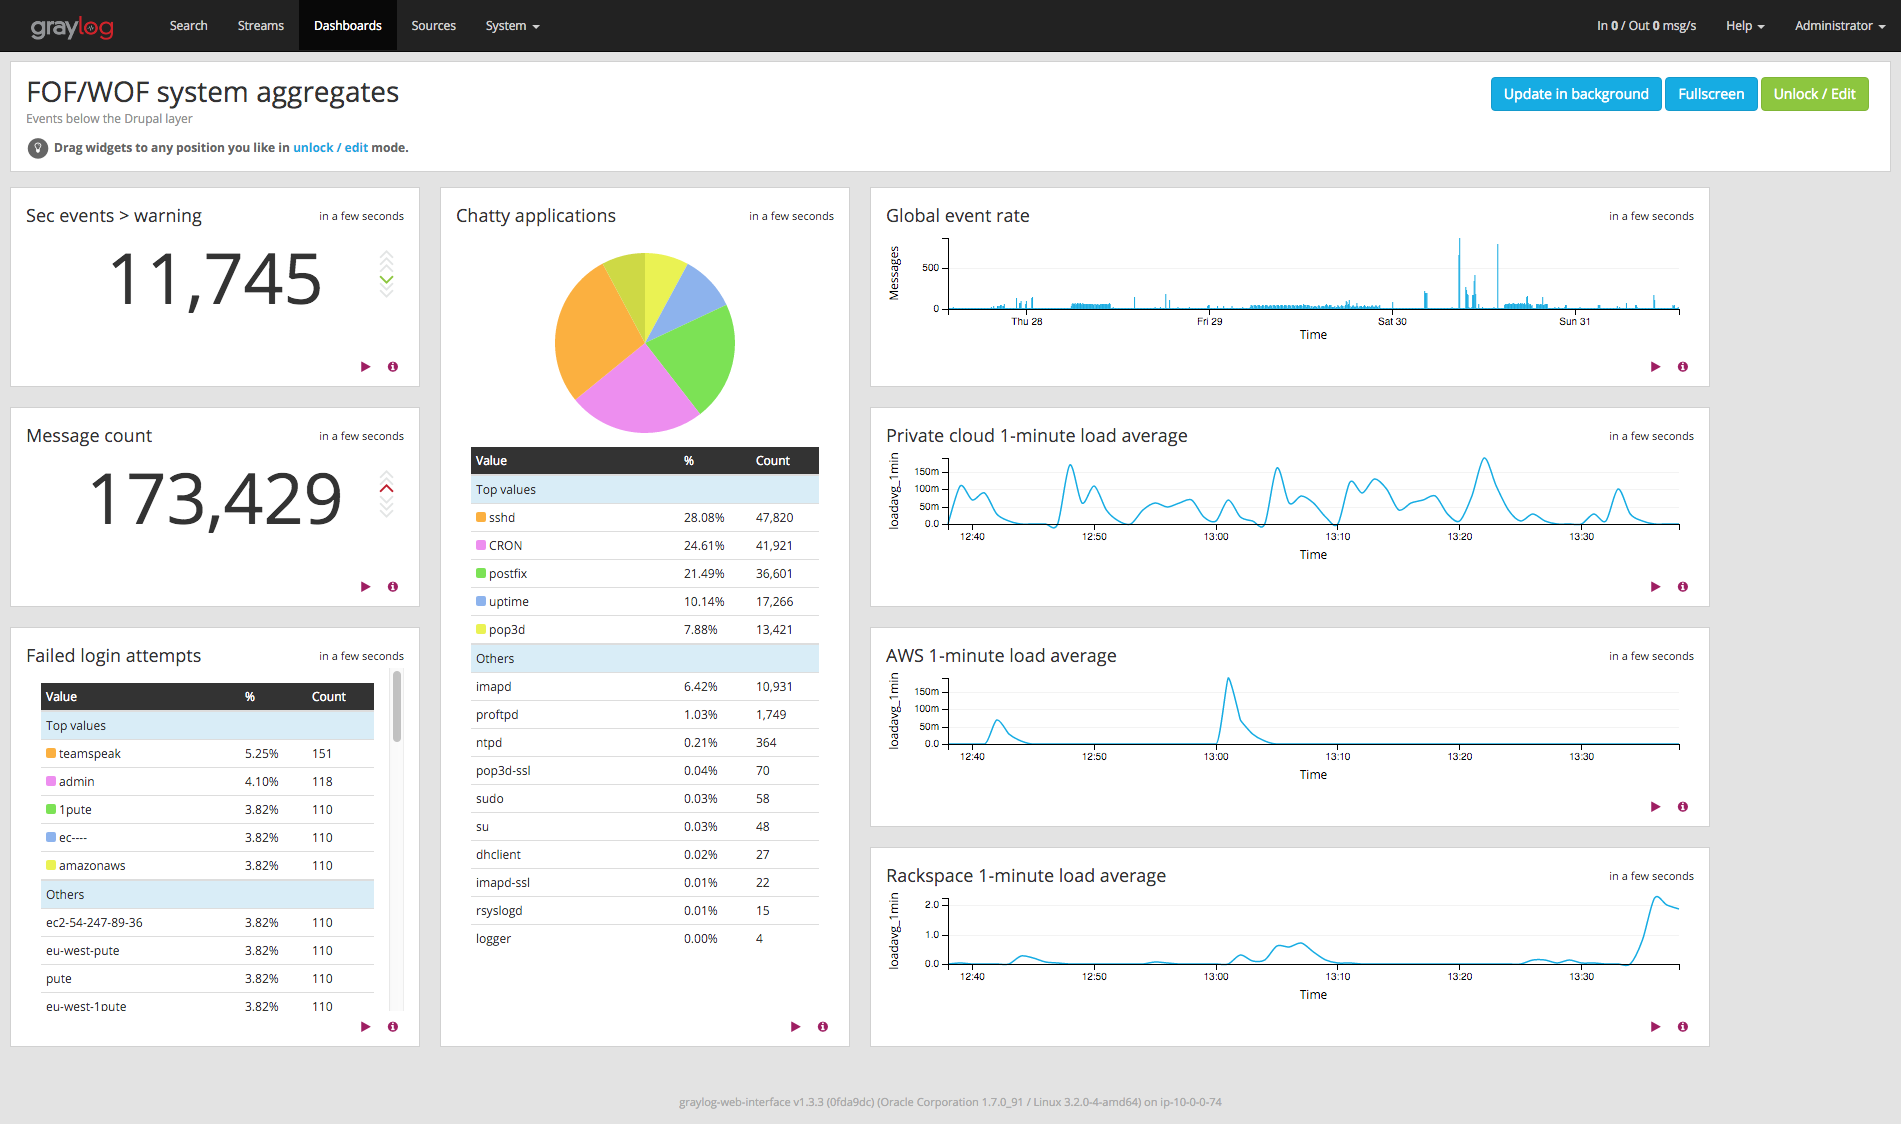
Graylog is, in the words of its creators, a tool to Store, search & analyze log data from any source, and it puts a lot of power in our hands to slice, dice, and generally combine, gather, and parse content from various sources, notably syslog and Gelf sources, as well as many file-type sources thanks to the Graylog Collector. Which means it makes it a snap to build event-oriented dashboards like the left part of this example, and even some event volume graphs like the topmost one on the right.

Graylog dashboard example on OSInet.fr

The problem: logging non-event information

This covers only logged events, which is fine overall, since Graylog is a log analysis platform, not a graph-oriented monitoring system like Munin / Cati / Ganglia et alii. However, in many cases, especially when building dashboards instead of performing some specific research, one may want to keep an eye on average system load, or other non-event information, if only to know when to switch one's attention to the monitoring system.

So how can one add system load information, which is not event-based, to a log dashboard like the three bottom-right graphs on the previous dashboard ?

Drupal tip of the day: how to drop the Simpletest collections when using Drupal with MongoDB

Submitted by Frederic Marand on

The problem

When running tests on a server using the recent versions of the MongoDB module for Drupal, and more specifically the MongoDB simpletests, the simpletest runner may leave droppings in your MongoDB Drupal database, which have no business remaining there. How to remove them while keeping the good collections ?

The typical case will be after a failed test runs, looking like this:

Git tip of the day : show the hottest files in a repo

Submitted by Frederic Marand on

When auditing or reviewing an unknown code base, I often have to decide which files to examine in priority. Beyond the usual heuristics for Drupal projects (hint: look at templates in D7), how can one find the parts most likely to contain problems ? This simple command set can help pinpoint troublemaking files quickly.

Drupal 8 tip of the day: replace hook_drush_command() by a YAML file

Submitted by Frederic Marand on

One of the big trends during the Drupal 8 creation has been the replacement of info hooks by two main mechanisms: annotations, and YAML files. In that light, hook_drush_command(), as the CLI equivalent of the late hook_menu, replaced by various YAML files, looks just like a perfect candidate for replacement by a commands section in some mymodule.drush.yml configuration file. Turns out it is incredibly easy to achieve. Let's see how to kill some hundred lines of code real fast !

Drupal 8 tip of the day: autoloaded code in a module install file

Submitted by Frederic Marand on
(updated 2017-08-30, see bottom of post). Autoloading in D8 is much more convenient that in previous versions, however, it still has limitations. One such issue is with hook_requirements(), which is supposed to be present in the module install file, not the module itself: when called at runtime for the site report page, the module is loaded and the PSR/4 autoloader works fine. However, when that hook is fired during install to ensure the module can indeed be enabled, the module is not yet enabled, and the autoloader is not yet able to find code from that module, meaning the hook_requirements('install') implementation cannot use namespaced classes from the module, as they will not be autoloadable. What are the solutions ?

Logging for MongoDB

Submitted by Frederic Marand on

One nice thing during Drupal 7/8 development is the ability, thanks to the devel module, to get a list of all SQL queries ran on a page. As I've been working quite a bit on MongoDB in PHP recently, I wondered how to obtain comparable results when using MongoDB in PHP projects. Looking at the D7 implementation, the magic happens in the Database class:

<?php
// Start logging on the default database.
define(DB_CHANNEL, 'my_logging_channel');
\Database::startLog(DB_CHANNEL);

// Get the log contents, typically in a shutdown handler.
$log = \Database::getLog(DB_CHANNEL);
?>

With DBTNG, that's all it takes, and devel puts it to good use UI-wise. So is there be an equivalent mechanism in MongoDB ? Of course there is !