Graylog is, in the words of its creators, a tool to Store, search & analyze log data from any source
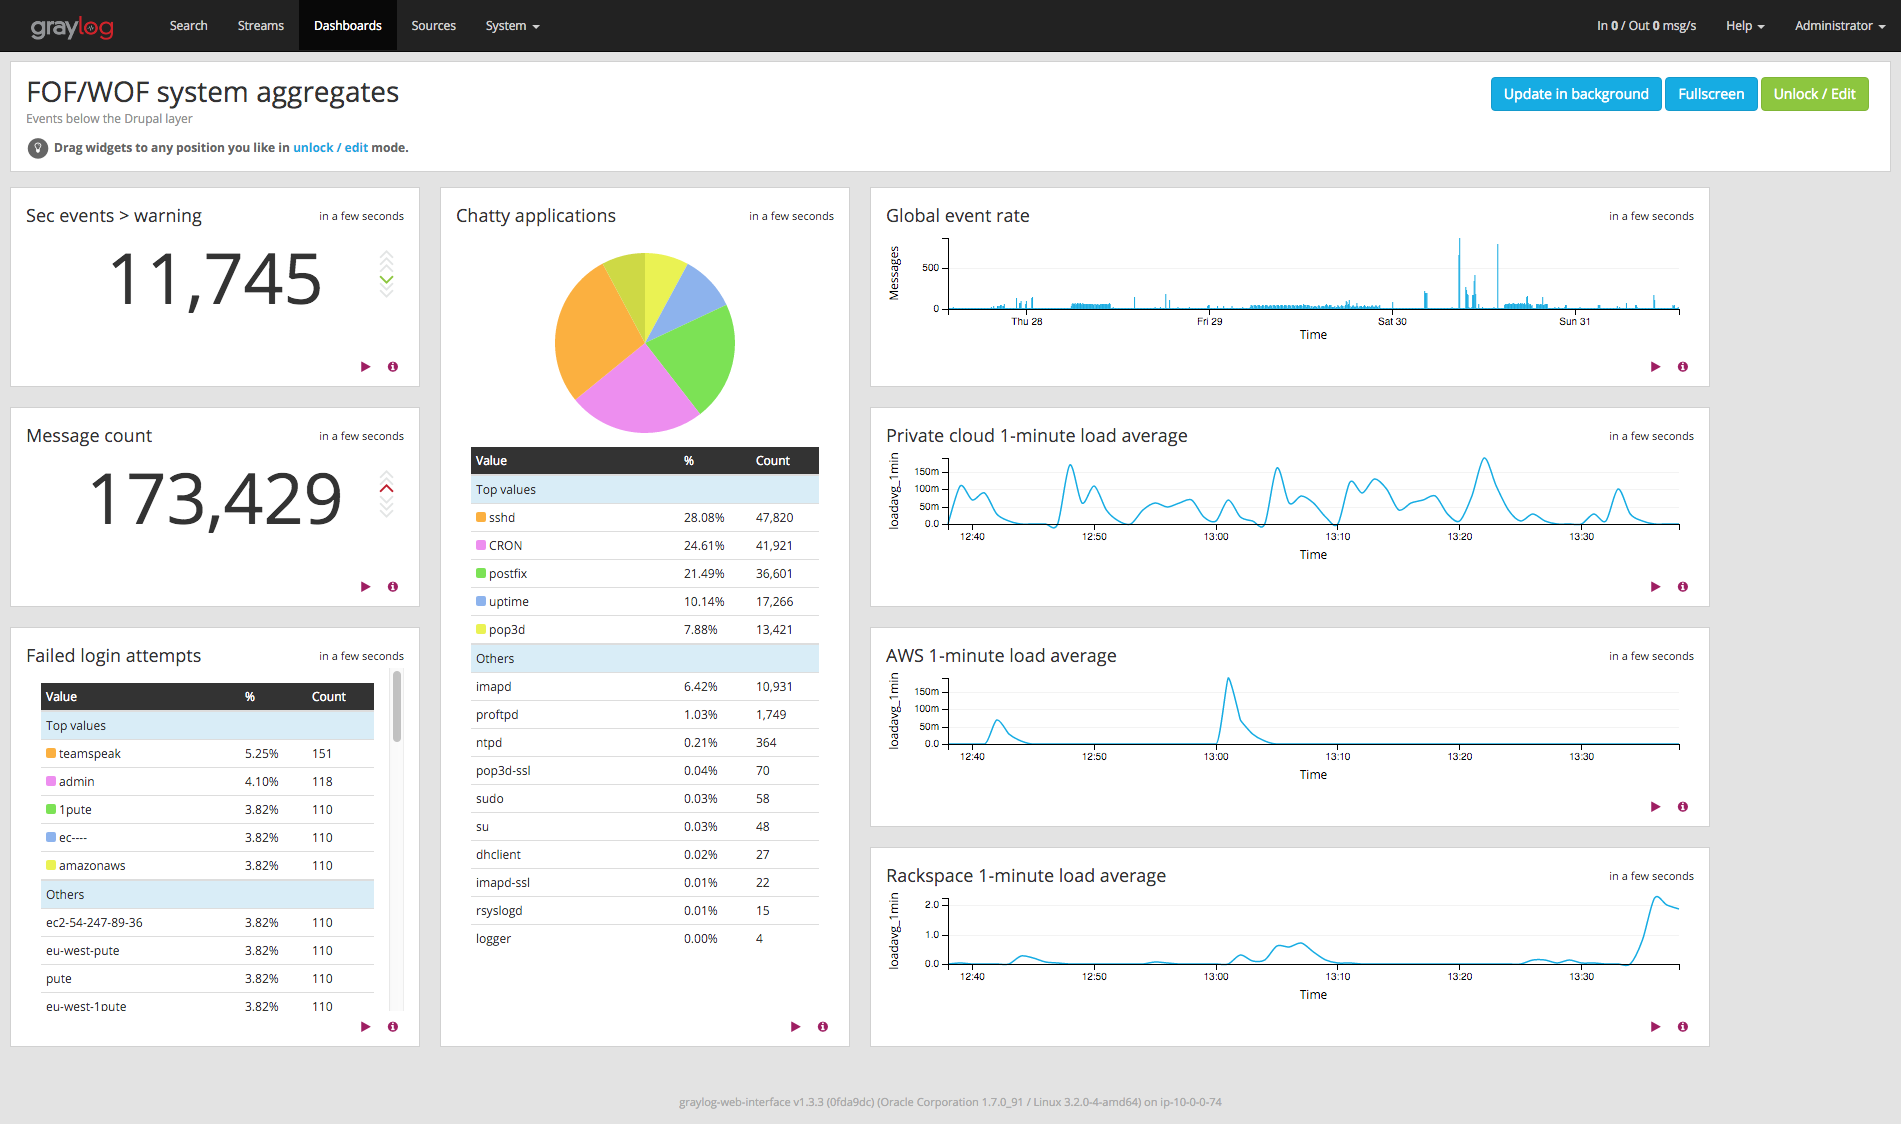
, and it puts a lot of power in our hands to slice, dice, and generally combine, gather, and parse content from various sources, notably syslog and Gelf sources, as well as many file-type sources thanks to the Graylog Collector. Which means it makes it a snap to build event-oriented dashboards like the left part of this example, and even some event volume graphs like the topmost one on the right.
The problem: logging non-event information
This covers only logged events, which is fine overall, since Graylog is a log analysis platform, not a graph-oriented monitoring system like Munin / Cati / Ganglia et alii. However, in many cases, especially when building dashboards instead of performing some specific research, one may want to keep an eye on average system load, or other non-event information, if only to know when to switch one's attention to the monitoring system.
So how can one add system load information, which is not event-based, to a log dashboard like the three bottom-right graphs on the previous dashboard ?
The solution: event creation
The solution is really simple : if there are no system load events, just add them ! This is just a three-step process.
Step 1: Getting the information
Linux distributions usually includes the uptime(1) command, which outputs results like the following:
13:52:35 up 47 days, 2:09, 1 user, load average: 0.00, 0.01, 0.05
They also include the logger(1) command, to send just about any free-form string to syslog, possibly tagging it along the way. Let's use it to create an uptime-tagged event and send it to syslog:
uptime | logger -t uptime
Now all we need is make sure this is sent every minute. The ubiquitous cron mechanism makes it easy. Let's just edit crontab by calling crontab -e and add a line like this.
* * * * * bash -c "uptime | logger -t uptime"
What's with the bash -c ? The thing is, in most cron implementations, it is not possible to run a pipeline, but only a single command. bash -c "some | pipeline" provides the way to wrap the pipeline in a single command without having to create a script just for this. And as to the five stars, they're just cron's way to describe a command to be run (1) each minute of (2) each hour of (3) each day of (4) each month, whatever the (5) weekday.
Step 2: Sending the information to the Graylog server
At this point, you should be starting to see lines appear in your syslog file, probably in a place like /var/log/syslog. Let's ask syslog to redirect them to Graylog. If you are using rsyslogd(8) on some Debian version, this configuration is in /etc/rsyslog.conf and the various /etc/rsyslod.d/*somemodule.conf. Let's add this configuration to the main config file:
First, define a format to use when sending the records. In most cases an existing format would already exist, but defining it explicitly helps us ensure platform independence.
$template GRAYLOGRFC5424,"<%PRI%>%PROTOCOL-VERSION% %TIMESTAMP:::date-rfc3339% %HOSTNAME% %APP-NAME% %PROCID% %MSGID% %STRUCTURED-DATA% %msg%\n"
What this line does if define a format which configuration directives will be able to use. So let's use it by adding a redirection directive. Adjust IP and port to point to your Graylog server :
*.* @10.0.0.20:10514;GRAYLOGRFC5424
Some aspects to consider:
- This directive sends everything over to the log server. In most cases, this is what you want, because your goal is likely to build a centralized log server. If this is not the case, adjust the
*.*pattern to only send uptime information. - Use of a single
@before the IPv4 address asks syslog to use UDP (two instead of one would ask for TCP). In most cases, this is what you want : for log aggregation, it is usually preferable to resist overload by losing part of the information than increasing client load by forcing a no-loss policy as happens with TCP - Use of port 10514, or any port above 1024, instead of the default 514, makes it easier on your Graylog servce installation, not requiring it to be allowed to listen on privileged (below 1024) ports.
Step 3: building the graph
 At this point, data has started to flow into our Graylog instance, looking very much like the results on the right. The interesting part is the message field, which Graylog's "extractors" allow us to massage a bit to obtain the information needed. Let's look at the message format ; it should look like this (quotes added):
" 13:23:01 up 13 days, 21:42, 0 users, load average: 0.02, 0.05, 0.10"
- The information we need for the 1-minute load would be
0.02. We can get it using a regular expression extractor based on this expression:"^.*load average: ([\\d.,]+),.*$", completed by adding the "Convert to numeric" option to enable numeric processing on the result. - Should we want the 5-minute load, here
0.05, we can use another regex, or a simpler "Split & Index" extractor, splitting on the comma and using target index 5 (1: " 13:23:01 up 13 days", 2: " 21:42", 3: " 0 users", 4: " load average: 0.02", 5: " 0.05", notice spaces), also completed by the numeric converter.
Side notes:
- Check the exact format of your uptime output. On some servers, I noticed the numbers would be formatted using a non-default locale, like
fr_FR.UTF-8, causing the numbers to look like0,05instead of0.05. To prevent the problem, addLANG=Cat the top of your crontab file at step 1. Better than having to tweak extractors per-server. - If you are centralizing data for multiple servers, be sure to filter by source too.
At that point, the data is ready in Graylog. Head over to the Search page, and specify a filter on uptime: application_name:uptime. Assuming you named your extractor loadavg_1min, select that field in the list on the left, and unfold it, you should see a small table with three choices: "Statistics", "Quick values", and "Generate chart". Use the latter: your load average chart will be displayed on the right. Customize to your heart's content (my preferences: value → mean, type → line, interpolation → cardinal, resolution → minute), then add to the dashboard of your choice. Enjoy.
Going further
- The uptime_extractors.json file attached to this article contains the definitions of the two Graylog extractors for you to import on your Graylog instance.
- Much more information is available on the graylog.org site and repo at https://github.com/Graylog2/graylog-guide-syslog-linux.