How to add a server load graph to a Graylog dashboard
Graylog is, in the words of its creators, a tool to Store, search & analyze log data from any source
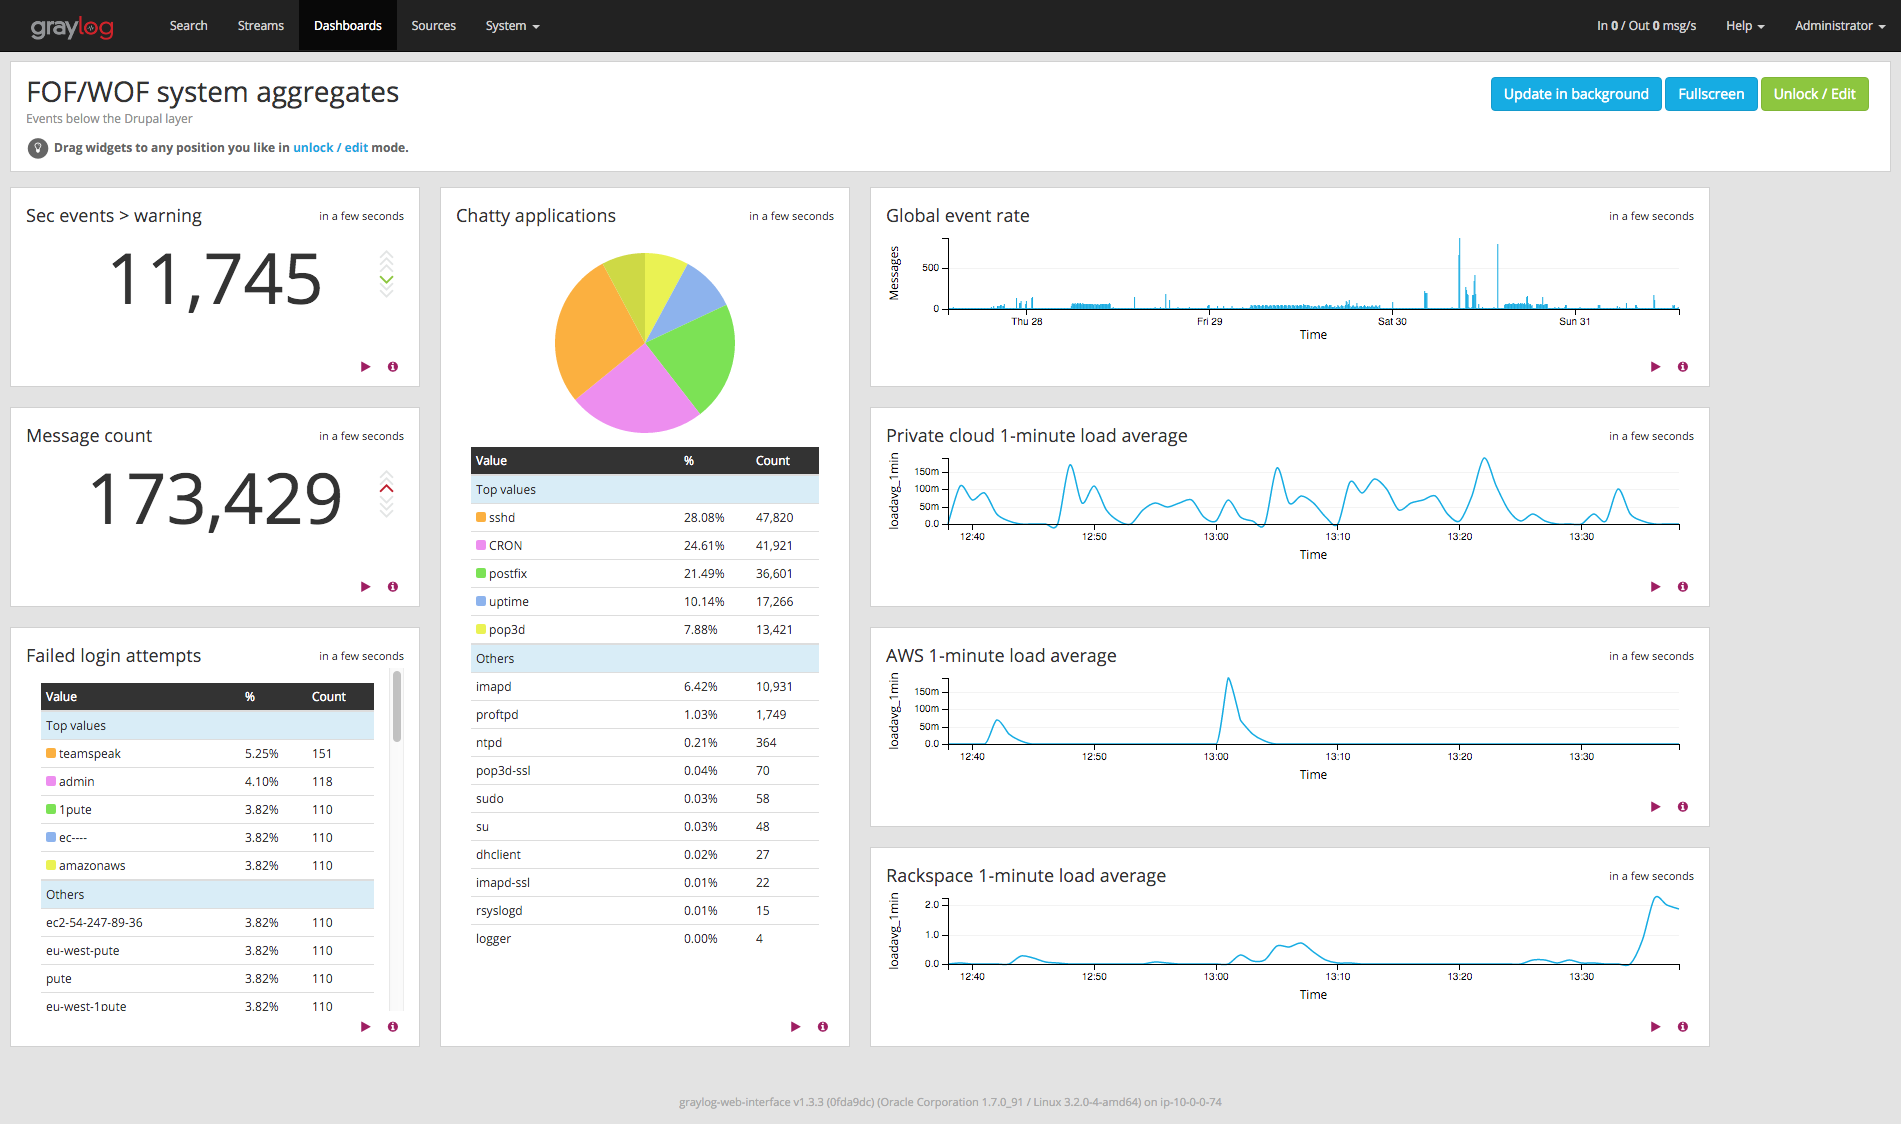
, and it puts a lot of power in our hands to slice, dice, and generally combine, gather, and parse content from various sources, notably syslog and Gelf sources, as well as many file-type sources thanks to the Graylog Collector. Which means it makes it a snap to build event-oriented dashboards like the left part of this example, and even some event volume graphs like the topmost one on the right.
The problem: logging non-event information
This covers only logged events, which is fine overall, since Graylog is a log analysis platform, not a graph-oriented monitoring system like Munin / Cati / Ganglia et alii. However, in many cases, especially when building dashboards instead of performing some specific research, one may want to keep an eye on average system load, or other non-event information, if only to know when to switch one's attention to the monitoring system.
So how can one add system load information, which is not event-based, to a log dashboard like the three bottom-right graphs on the previous dashboard ?